Micah Gemeniano’s Docs
| Has attachment | Title | Author | Created | Last Edited | Tags |
|---|---|---|---|---|---|
|
MT 14 LEC – BB 𝙑𝙞𝙩𝙖𝙁𝙡𝙖𝙨𝙝 𝙇𝙖𝙗𝙤𝙧𝙖𝙩𝙤𝙧𝙮 𝙄𝙣𝙛𝙤𝙧𝙢𝙖𝙩𝙞𝙤𝙣 𝙎𝙮𝙨𝙩𝙚𝙢 utilizes a Fishbone Diagram, also known as Ishikawa diagram, to determine causes of a specific effect. The laboratory acknowledges that laboratory errors would most likely be common in our laboratory, thus, we listed the reasons for this so that we could determine the factors that influences errors in the lab. Subsequently, the diagram will be utilized to enhance the VitaFlash Laboratory Information System.
MT 14 LEC – BB 𝙑𝙞𝙩𝙖𝙁𝙡𝙖𝙨𝙝 𝙇𝙖𝙗𝙤𝙧𝙖𝙩𝙤𝙧𝙮 𝙄𝙣𝙛𝙤𝙧𝙢𝙖𝙩𝙞𝙤𝙣 𝙎𝙮𝙨𝙩𝙚𝙢 utilizes a Fishbone Diagram, also known as Ishikawa diagram, to determine causes of a specific effect. The laboratory acknowledges that laboratory errors would most likely be common in our laboratory, thus, we listed the reasons for this so that we could determine the factors that influences errors in the lab. Subsequently, the diagram will be utilized to enhance the VitaFlash Laboratory Information System. |
Marc Britney S. Cubalan | December 18, 2023 | December 18, 2023 | ||
|
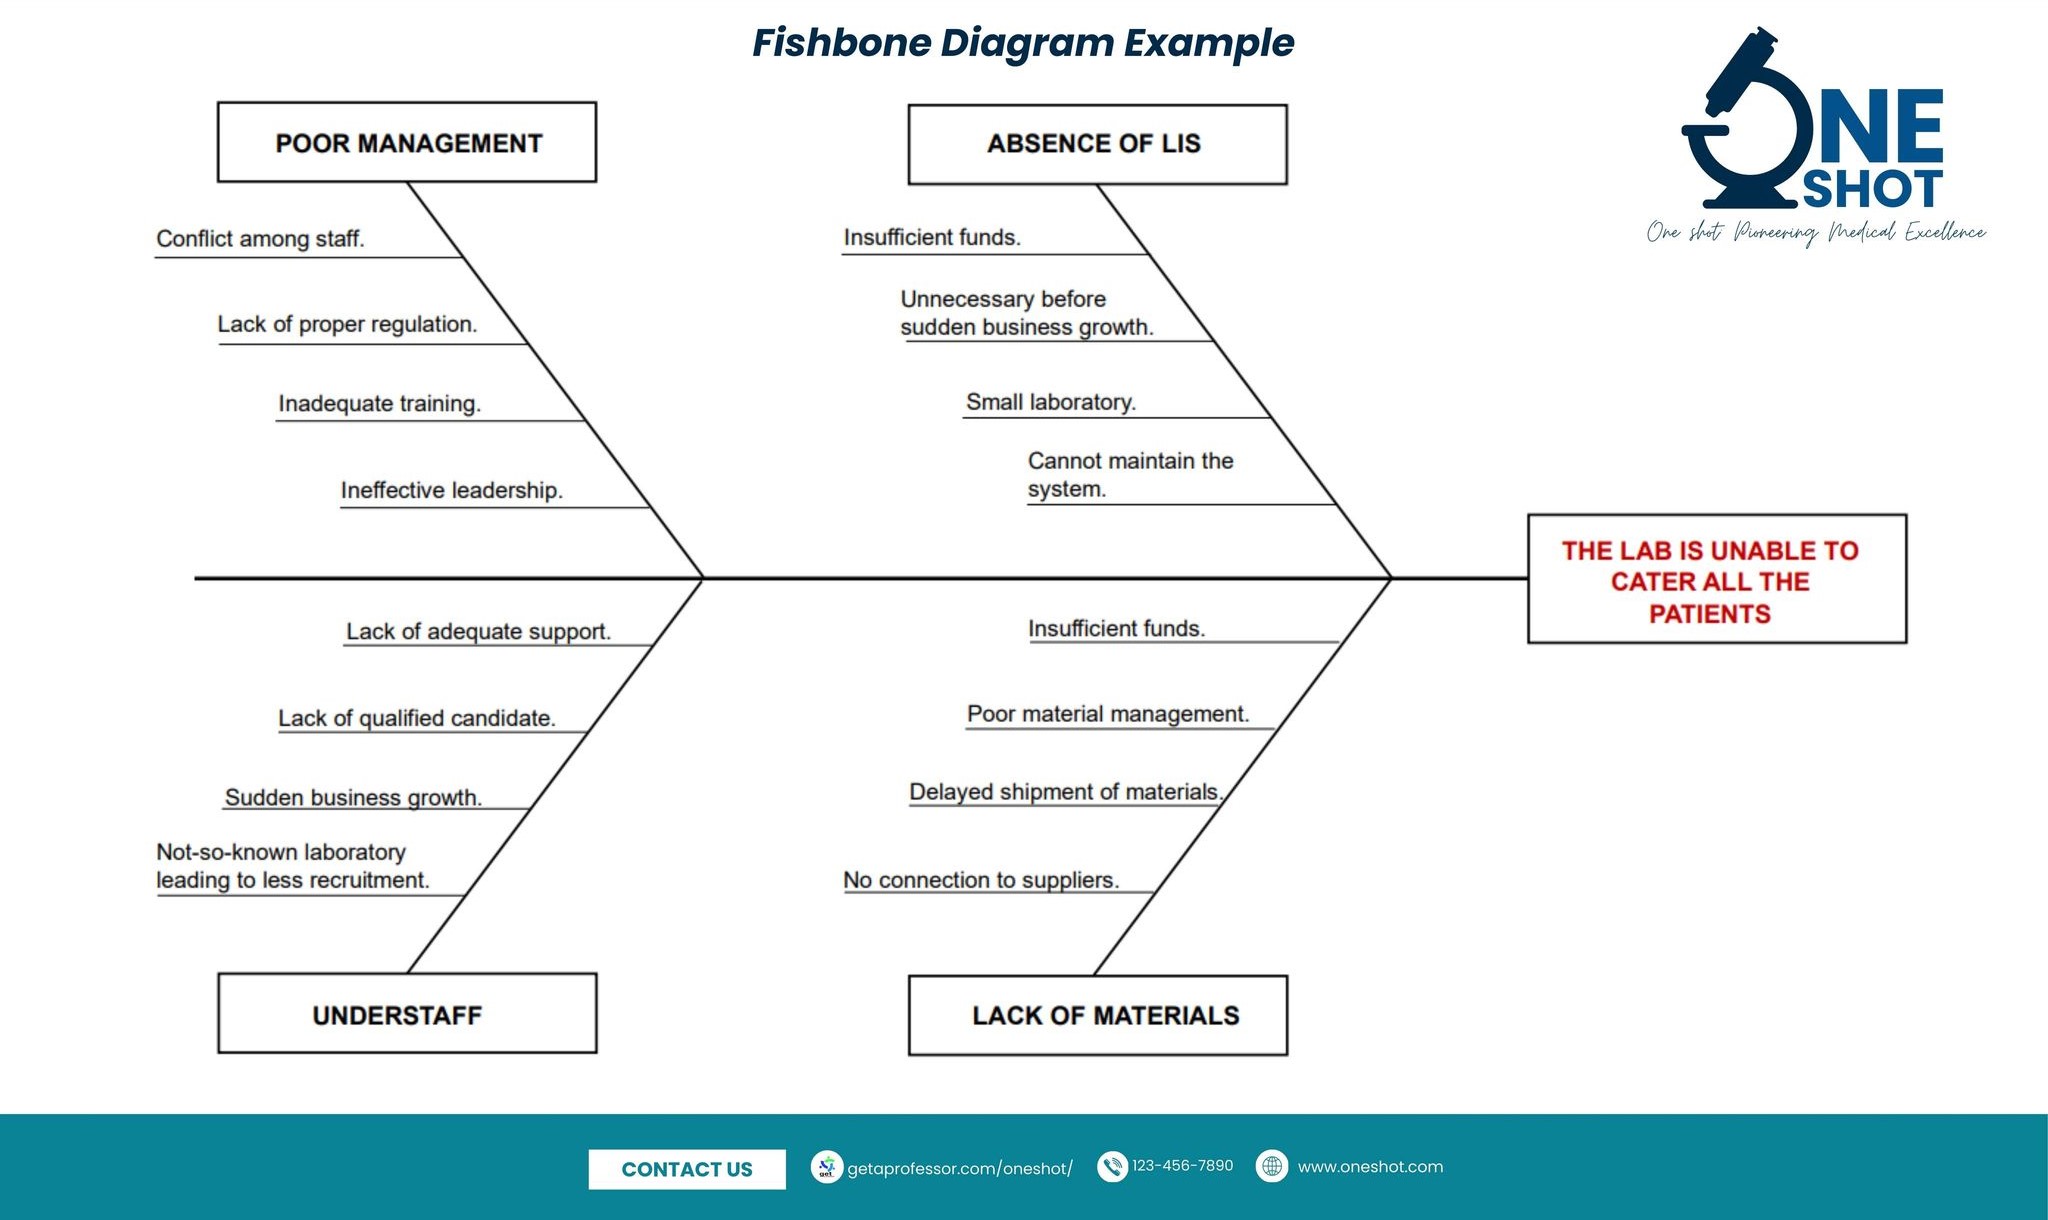
One Shot Laboratory Fishbone Diagram (Doc Ver)
At One Shot Laboratory, our unwavering commitment is to deliver top-quality care to our patients. Achieving this involves meticulous identification and resolution of laboratory challenges. Sharing with you our laboratory’s fishbone diagram that guides us in addressing issues and ensuring the delivery of optimal care. Because providing the very best is not just a goal but a dedicated practice at One Shot Laboratory! |
Jonier M. Badayos | December 18, 2023 | December 18, 2023 | ||
|
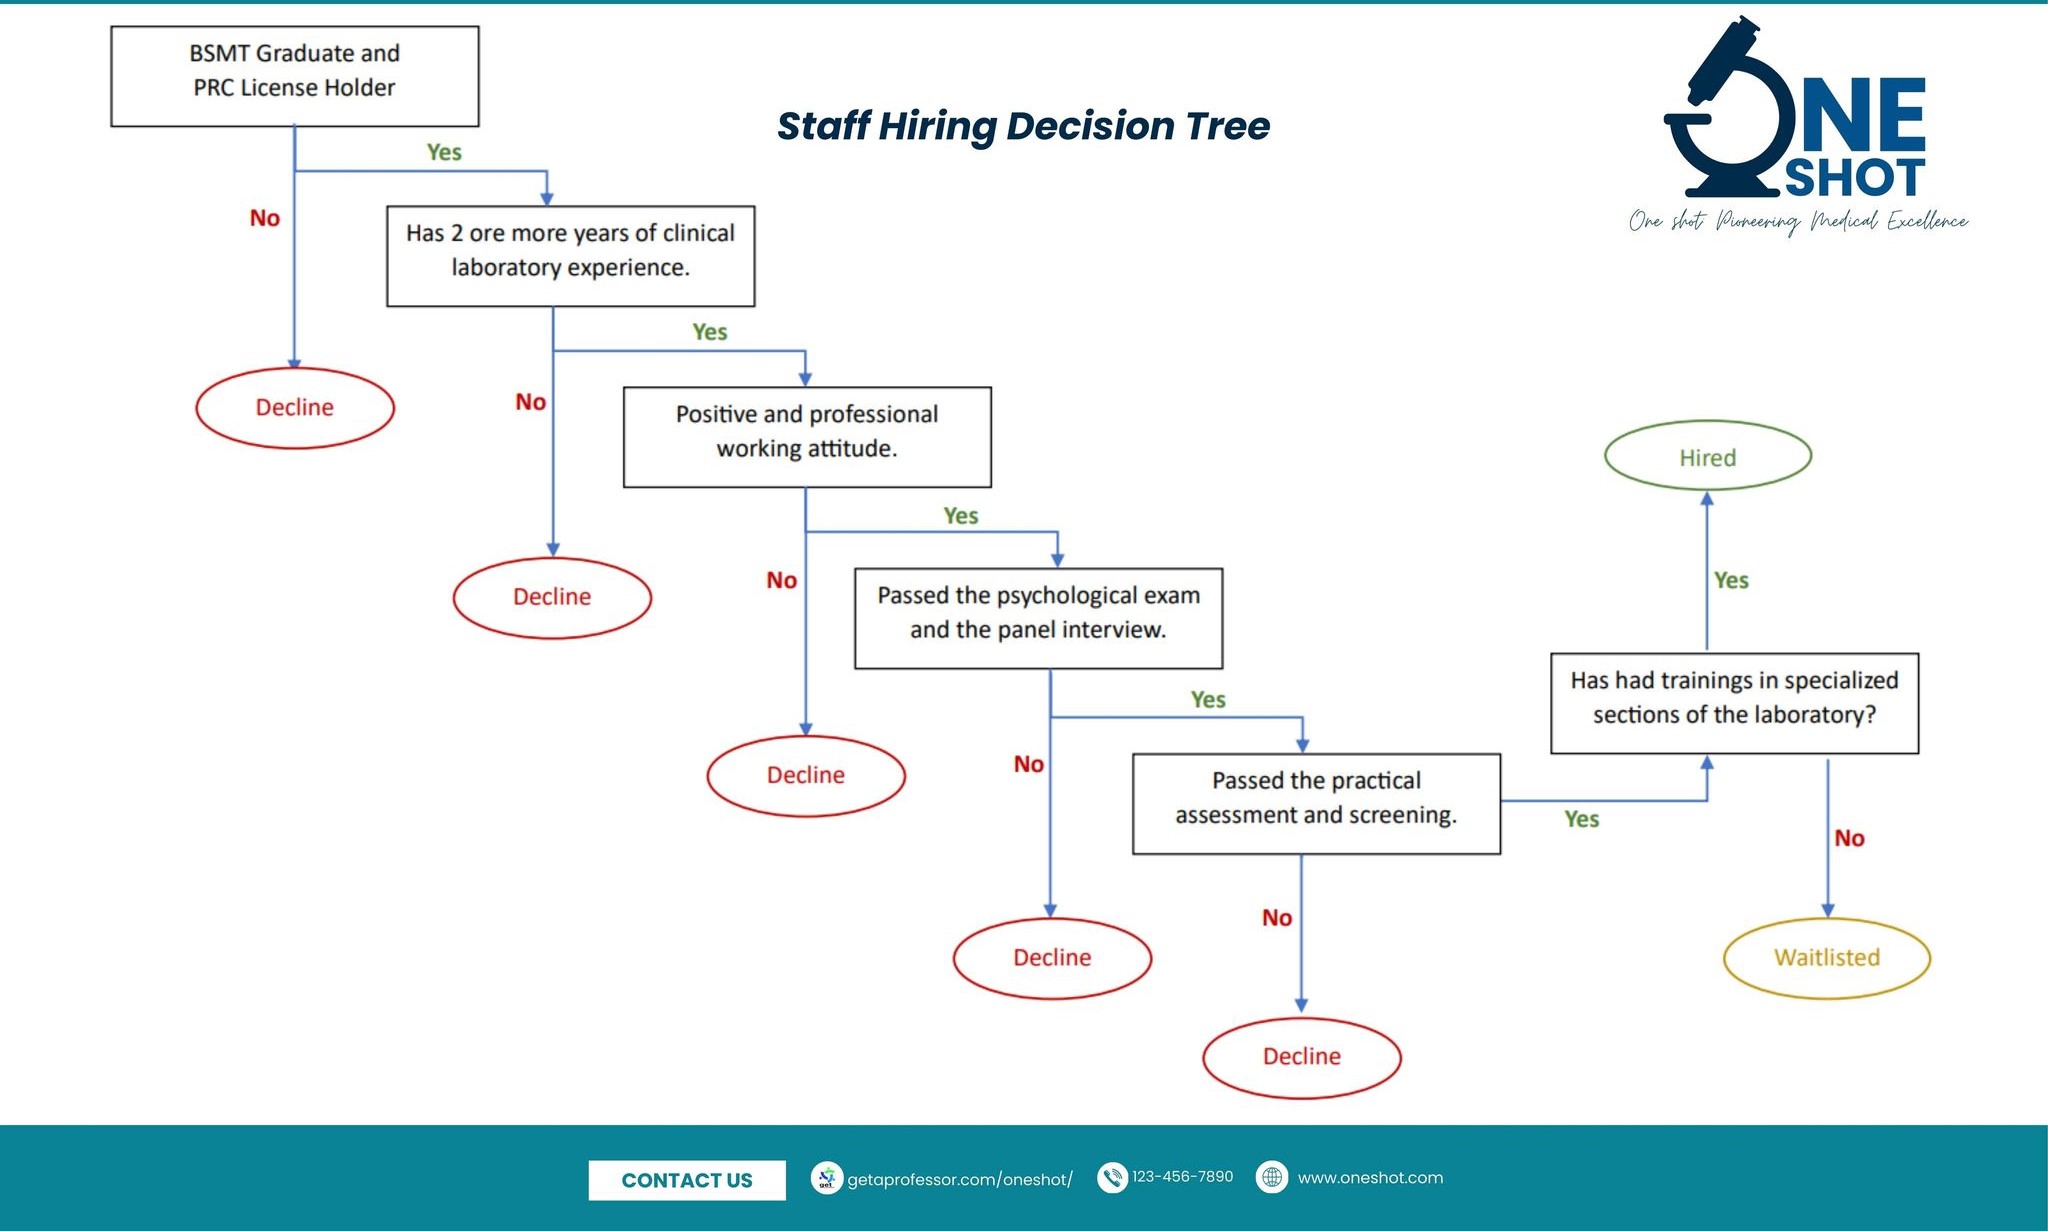
One Shot Laboratory Decision Tree (Doc Ver)
Unlocking clarity in every choice at One Shot Laboratory! Introducing the Decision Tree guiding our laboratory’s strategic decisions. Because in our commitment to excellence, every decision counts! #OneShotDecides |
Jonier M. Badayos | December 18, 2023 | December 18, 2023 | ||
|
VitaFlash Fishbone Diagram
𝙑𝙞𝙩𝙖𝙁𝙡𝙖𝙨𝙝 𝙇𝙖𝙗𝙤𝙧𝙖𝙩𝙤𝙧𝙮 𝙄𝙣𝙛𝙤𝙧𝙢𝙖𝙩𝙞𝙤𝙣 𝙎𝙮𝙨𝙩𝙚𝙢 utilizes a Fishbone Diagram, also known as Ishikawa diagram, to determine causes of a specific effect. The laboratory acknowledges that laboratory errors would most likely be common in our laboratory, thus, we listed the reasons for this so that we could determine the factors that influences errors in the lab. Subsequently, the diagram will be utilized to enhance the VitaFlash Laboratory Information System. Submitted by: Britney Cubalan Mary Cuevas Nicole Doyongan Jay Etic Dan Esmeralda Michelle Fernando Rayza Fortos Leanne Enot Mikaella Flores… Read More |
Jay Venci Etic | December 19, 2023 | December 19, 2023 | ||
|
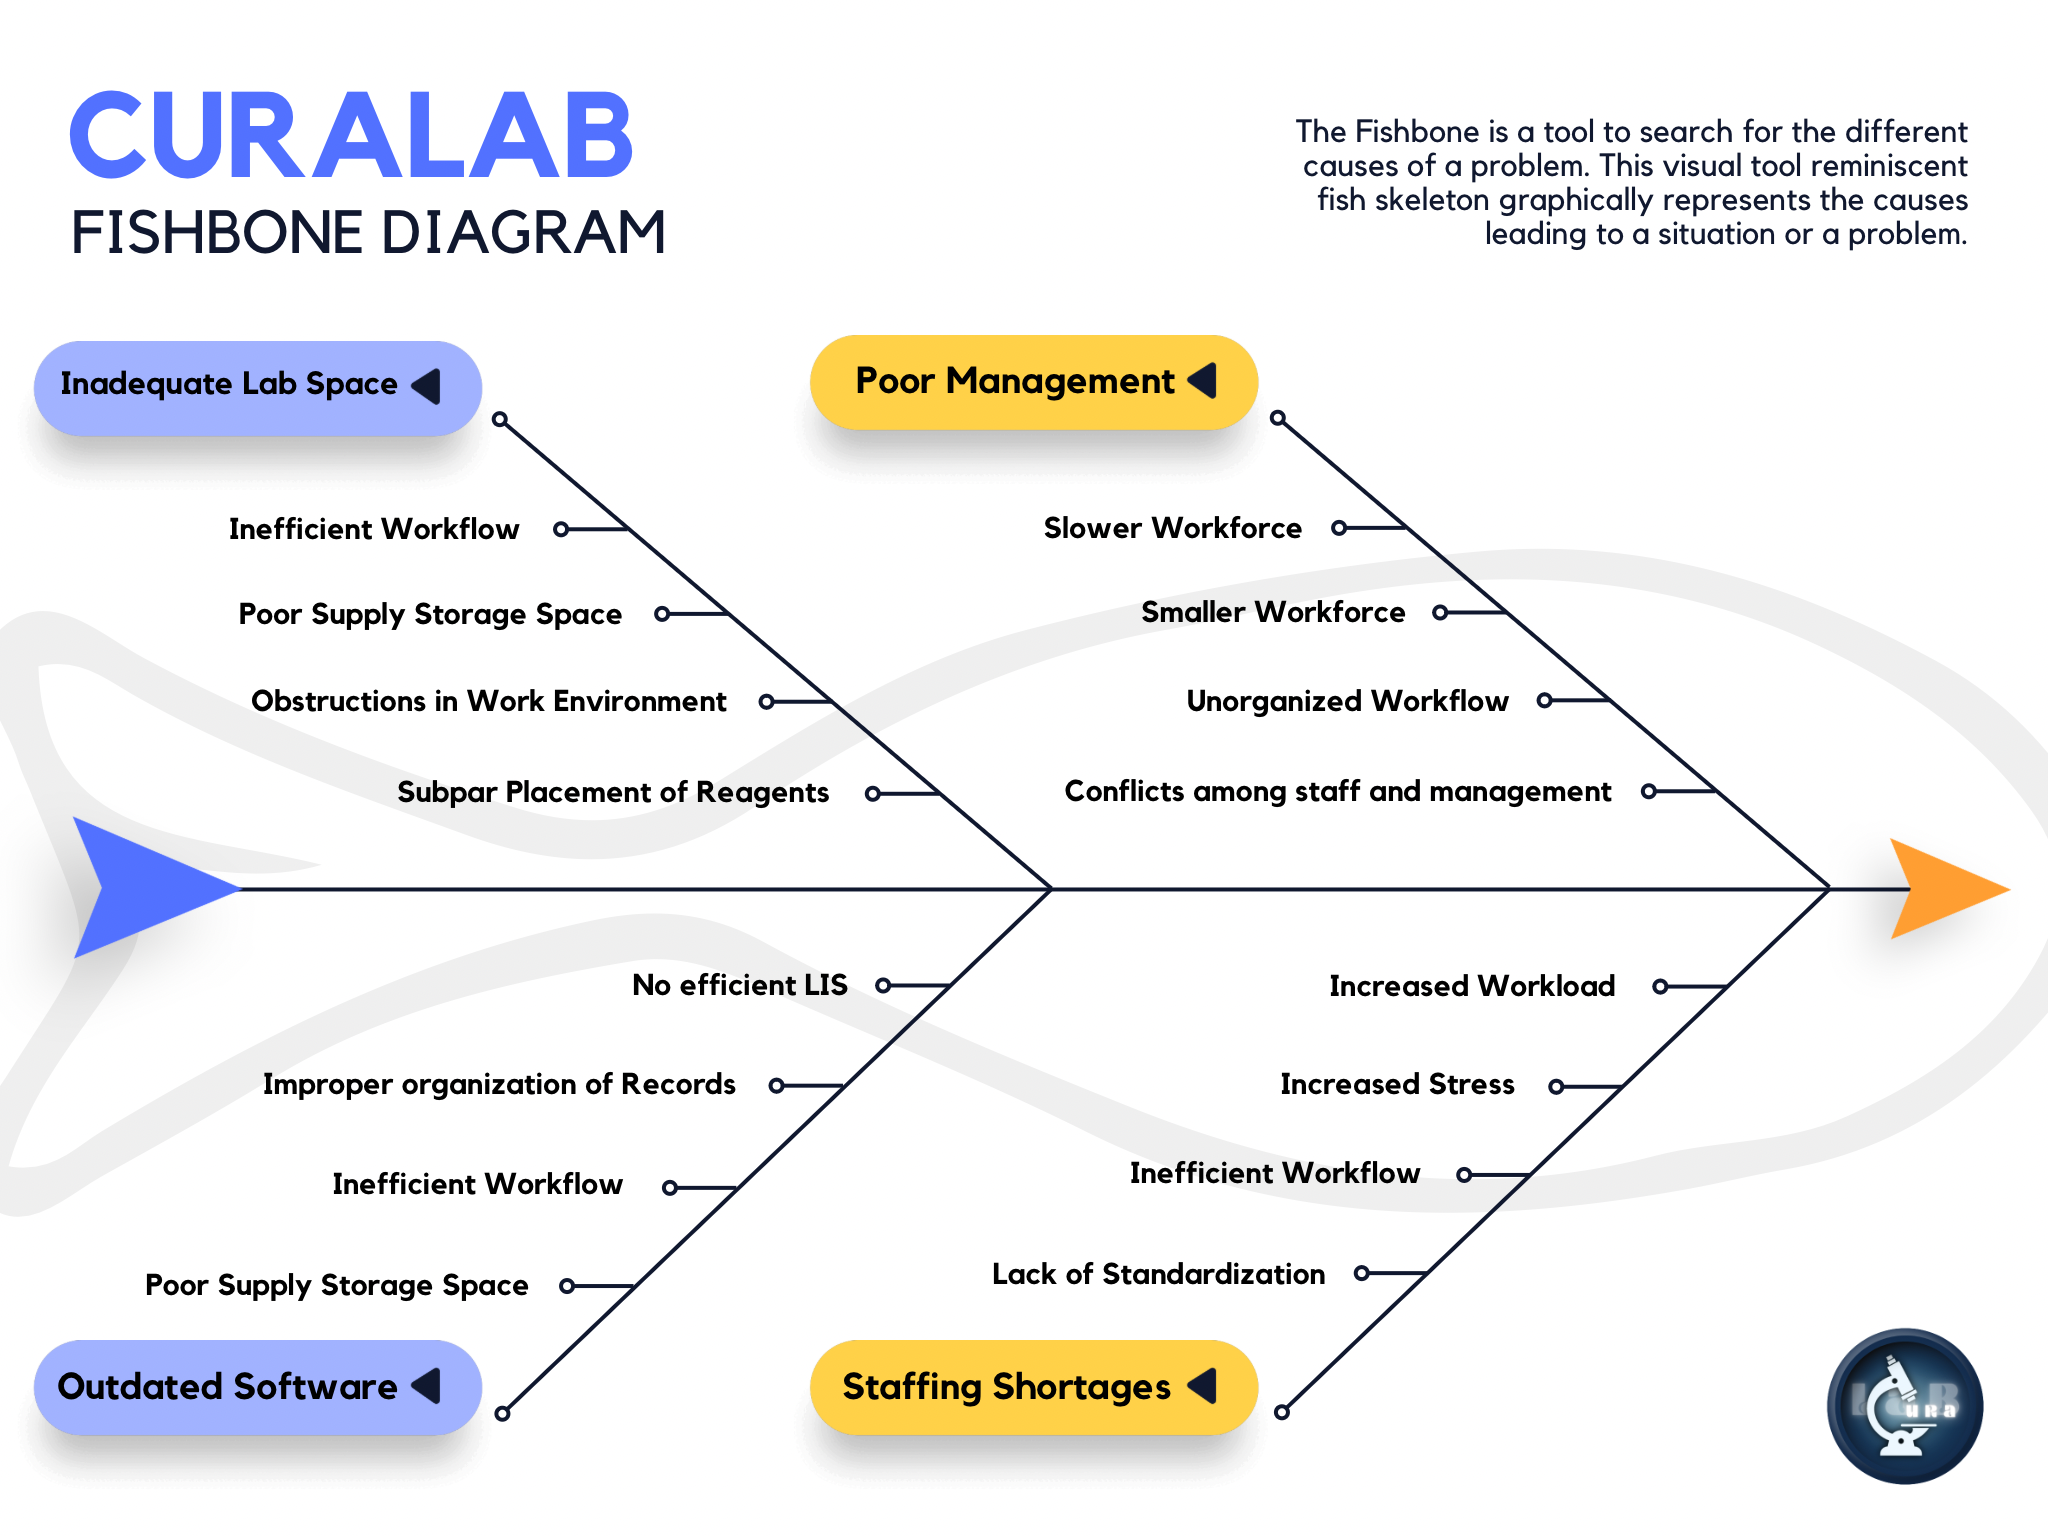
Fishbone Diagram of CuraLab
|
Shane | December 19, 2023 | December 19, 2023 | ||
|
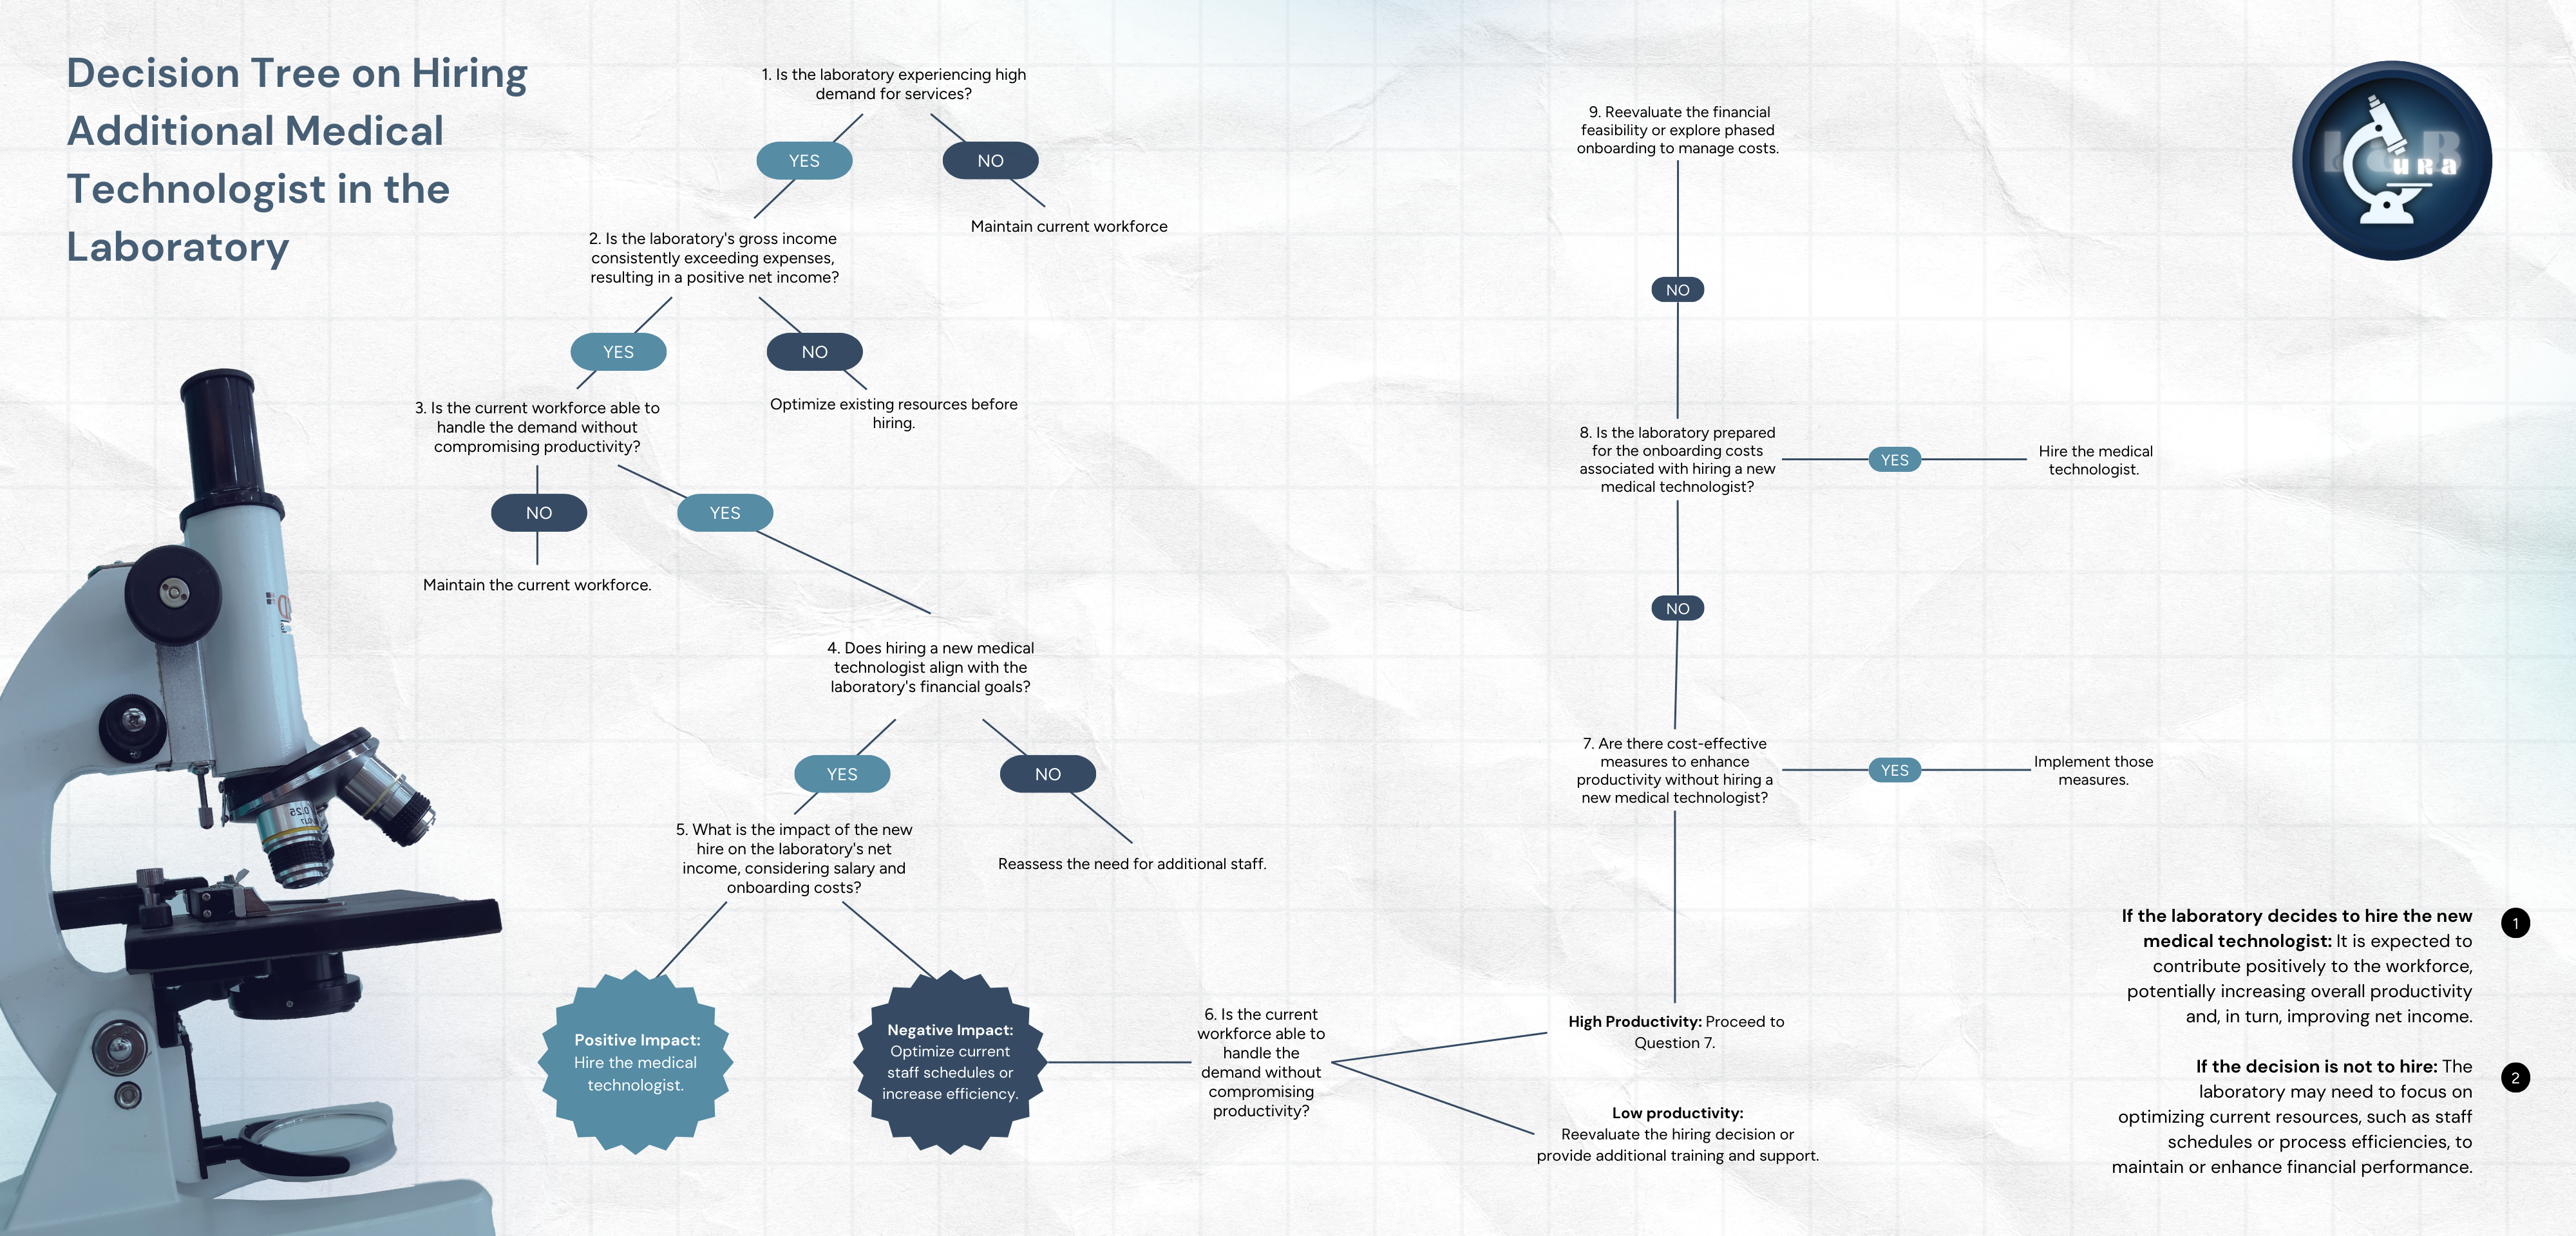
Decision Tree of CuraLab
|
Shane | December 19, 2023 | December 19, 2023 | ||
|
Fishbone Diagram of CuraLab
|
Melbe Pajantoy | December 20, 2023 | December 20, 2023 | ||
|
Decision Tree of CuraLab
|
Melbe Pajantoy | December 20, 2023 | December 20, 2023 | ||
|
ONE SHOT DECISION TREE
|
Lorraine V. Bernales | December 23, 2023 | December 23, 2023 | ||
|
ONE SHOT FISHBONE DIAGRAM
|
Lorraine V. Bernales | December 23, 2023 | December 23, 2023 |